
Monitor any command typed at a shell with eBPF
Have you ever logged on to a server or workstation and asked yourself “I wonder what other users are executing right now?”. Well, I certainly have and I’m always curious about what is running processes on a system. But figuring out what is currently running on a system is not that difficult of a question to answer. Any Linux system comes preinstalled with tools like top that can exactly show you all the running processes on the system. But that’s not what I’m talking about here, I want a record of every command typed at any shell new or old currently in use on the system. This seems like a pretty tough challenge, but there are hidden powers inside the Linux kernel that make this task rather straight forward.
These hidden powers I’m talking about are called eBPF and you might have used or heard about it before. As of late more and more tools are starting to leverage eBPF to build amazing things. Especially in the cloud-native space tools like Falco, Cilium and Calico leverage eBPF to build very performant networking or monitoring tools. BPF stands for Berkeley Packet Filter. Remember iptables? As the name implies, the original BPF allowed a user to specify rules that will be applied to network packets as they flow through the network. This has been part of Linux for years.
But when BPF got extended, it allowed users to add code to the kernel in a safe manner. What I mean by safe here is that these programs are run in a virtual machine inside the kernel, making it impossible for it to cause system-wide instabilities. Ever installed a driver and have it crash your whole system at the most inconvenient time? Well, I certainly have seen my fair share of BSOD’s. eBPF solves all of that by allowing you to safely attach probes to different parts of the kernel.
Safely running code in kernel mode, well that sounds rather interesting, doesn’t it? Well in this post I’ll walk you through how we can install a probe with eBPF to monitor commands as they are typed at any shell running on a Linux based system!
Spying on bash
To start let’s keep things simple and just focus on bash for now. To make it easier to work with eBPF we’ll install a tool named bpftrace. I’ll explain in a sec what this is and how it relates to eBPF. But first, let’s make sure we can get something up and running to make things a bit more tangible. On a Ubuntu-based system bpftrace is relatively straight-forward to install:
sudo apt install -y bpftraceOne of the cool things about bpftrace is that it comes preinstalled with a bunch of amazing tools. One of these preinstalled tools is named bashreadline.bt and does exactly what we need. When ran it starts monitoring every command entered in a bash shell. If bpftrace is installed, you should be able to locate it on your system with:
$ which bashreadline.bt
/usr/sbin/bashreadline.bt
To install an eBPF program you need to be root, this means that if you are running as a normal user you will need to prefix the bpftrace command with sudo. Besides running as sudo you also need the CAP_SYS_ADMIN capability, if you don’t know what this means and are not using docker for this then don’t worry about it. If you are using Docker then you will need to add this capability because docker will drop it by default. This can be done by adding --cap-add=SYS_ADMIN to your docker run command. But beware about using this on a production system, the CAP_SYS_ADMIN capability is a key that opens a lot of doors for the root user.
$ sudo bashreadline.bt
Attaching 2 probes...Tracing bash commands... Hit Ctrl-C to end.TIME      PID    COMMAND12:53:31  30543  ls12:53:33  30543  date12:54:04  30949  echo "hello world"12:54:07  30949  sudo -s12:54:30  31125  ps aux12:54:47  30543  df -h12:54:49  31125  dir
When ran bpftrace will first compile the given script to eBPF byte code, this compiled program will then attach 2 probes to the kernel. As you can see from the above example the program immediately starts logging any command that gets typed. It shows the timestamp the command was run and the process id where it originated from. While you are still monitoring try elevating a shell as root (it’s also what I did), you will see that even for the root user you can snoop any command that gets typed. When executed this powerfull one-liner instruments all running bash shells and even monitors new ones when they pop up. This means that you can walk up to any system that has never run eBPF before and say “so what’s getting executed in bash at the moment?”. Pretty scary stuff right?
Under the hood
Let’s dive into the script and try to figure out how it works. The script can be found in the bpftrace Github repo inside the tools folder and is just a couple lines of code.
BEGIN{    printf("Tracing bash commands... Hit Ctrl-C to end.\n");    printf("%-9s %-6s %s\n", "TIME", "PID", "COMMAND");}
uretprobe:/bin/bash:readline{    time("%H:%M:%S  ");    printf("%-6d %s\n", pid, str(retval));}
To better understand what’s going on we’ll need a quick primer in eBPF and bpftrace. We already know that eBPF allows us to run small programs inside a VM within the Linux kernel. Which in turn allows us to attach probes and instrument different parts of the system. bpftrace on the other hand simplifies working with eBPF by giving access to a higher-level language that with the help of LLVM allows scripts to compile down to BPF byte code. The language itself is inspired by awk and C, allowing us to write anything from complex programs all the way to single nifty one-liners.
The following image gives an overview of all the probes we can add to different parts of the kernel:
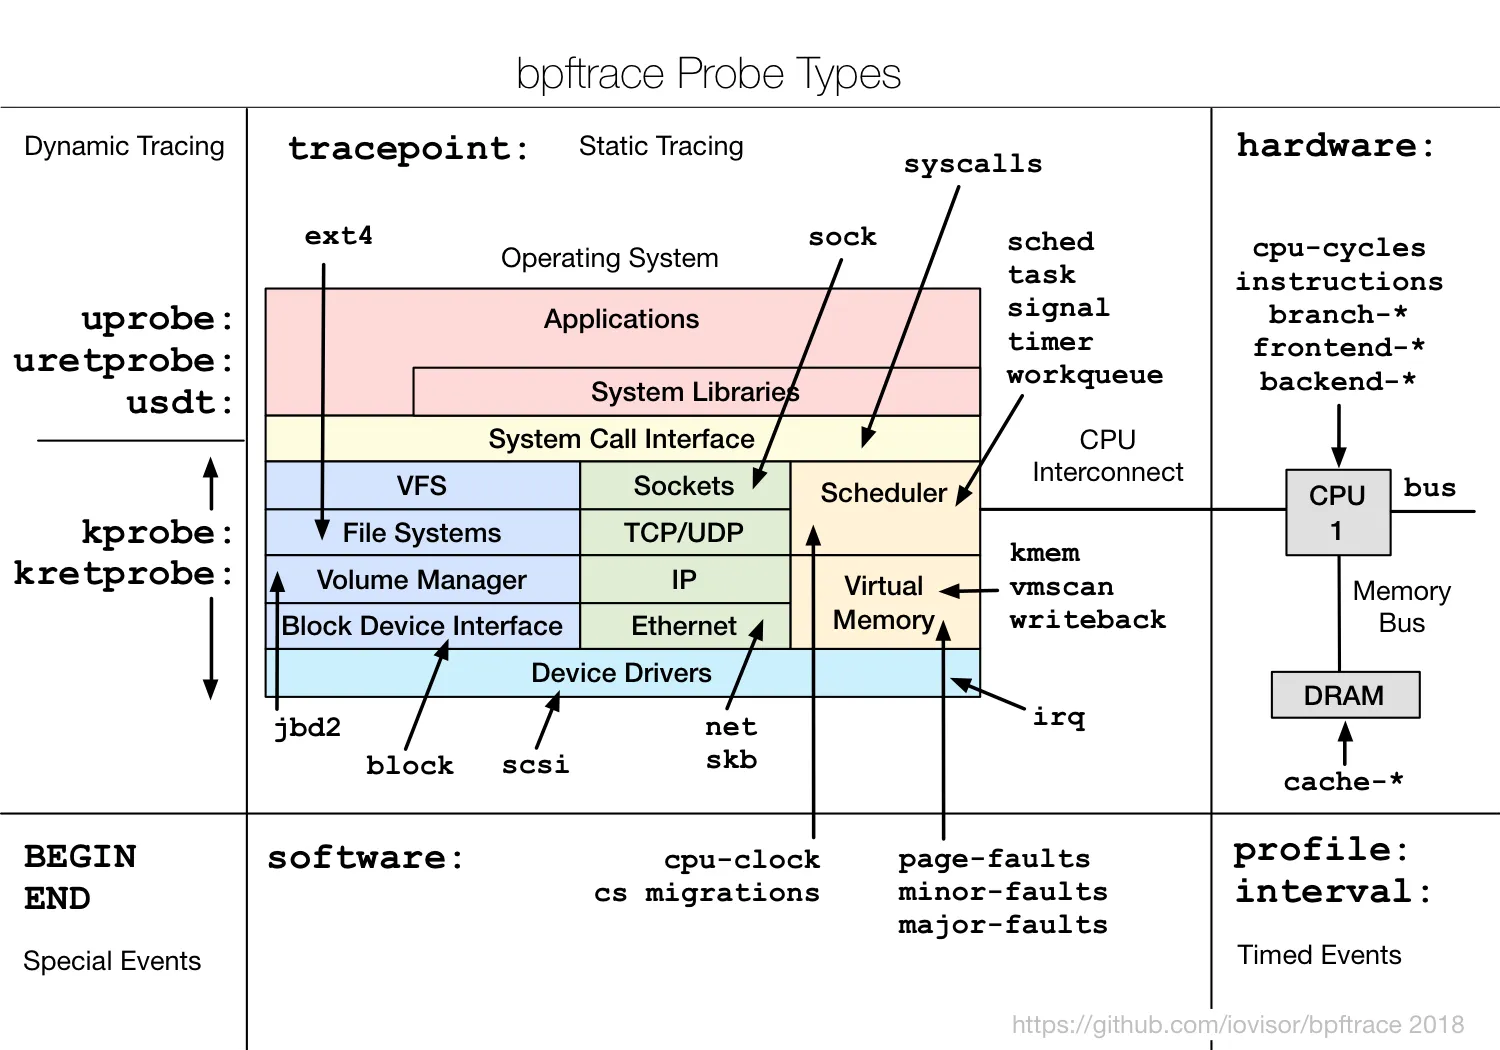
I won’t be diving into all the different probes available, there is a good reference guide available in the bpftrace repo if you are interested. The probes we are interested in here are the uprobe and the uretprobe, they both allow instrumentation of user-level dynamic functions. This allows us to add instrumentation around functions in a user-level library or executables like libc or bash. The syntax works as follows:
uprobe:library_name:function_name[+offset]uprobe:library_name:addressuretprobe:library_name:function_nameuprobes instrument the beginning of a user-level function’s execution, allowing us to inspect arguments passed into the function. uretprobe on the other hand instruments the end of a function call, giving access to its return value. From the syntax example above you can replace library_name with basically any executable on the system, which is what is being done in the bashreadline script.
With that short eBPF and bpftrace introduction out of the way let’s have a look at how we can read commands enter at a bash command prompt. The bpftrace script installs a uretprobe for /bin/bash around a function named readline. In bash every command entered at the prompt gets returned by the readline function, hence why uretprobe is used. To list available uprobes, you can use any program to list the text segment symbols from a binary, such as objdump and nm. For example:
$ objdump -tT /bin/bash | grep readline
0000000000124e60 g    DO .bss   0000000000000008  Base        rl_readline_state00000000000b7cc0 g    DF .text  0000000000000252  Base        readline_internal_char00000000000b7190 g    DF .text  000000000000015f  Base        readline_internal_setup0000000000087110 g    DF .text  000000000000004c  Base        posix_readline_initialize00000000000b8520 g    DF .text  000000000000009a  Base        readline0000000000124530 g    DO .bss   0000000000000004  Base        bash_readline_initialized...
This lists a bunch of functions containing readline inside bash that we can use to instrument with uprobe or uretprobe. To try this out we can play around with a single line bpftrace script from the command line. To keep it simple let’s print a message each time a command gets executed.
➜ bin sudo bpftrace -e 'uretprobe:/bin/bash:readline { printf("read a line\n"); }'Attaching 1 probe...read a lineread a lineread a lineread a line^CAnd that’s basically everything there is to it. To finish it off we have access to a couple of global variables like pid to get a reference to the process id the event was triggered from and retval which is the value returned from the function. Thus if we change our printf function to a templated string we can print out all information exactly like the original script. The original script uses a BEGIN probe to print out a neat little header.
bashreadline + zsh = zshsnoop
If you experimented a bit you might have noticed that bashreadline only works for bash processes, hence the name. If you are a zsh user commands typed in your favourite shell aren’t getting logged. This is a bit anticlimactic because I told you we would be creating or using a program that would be able to monitor any shell on the system. Well, we just figured out how it works for bash, let’s see if we can port basreadline into a script that works for zsh. Let’s call this script zshsnoop.
bashreadline depends on instrumenting a bash specific user-mode API call, that’s why instrumenting the readline API will not work when you are executing commands in zsh. This readline function call doesn’t exist in the zsh binary, so let’s try and figure out if there is an equivalent in zsh.
We’ll need to do some research here. In bash the readline function is also available from the command line. So let’s see if there is a zsh equivalent for this command. According to stackexchange, zsh doesn’t use readline (which is what we expected already) but instead is using something called zle. Like we did for bash let’s dig dump the symbols for the zsh binary and filter for any function containing zle. Maybe we find something that we can use to hook into to:
$ objdump -tT /usr/bin/zsh | grep zle
0000000000054570 g    DF .text  0000000000000262  Base        zleentry000000000006f920 g    DF .text  0000000000000039  Base        zlevarsetfn00000000000e57a0 g    DO .bss   0000000000000004  Base        zlemetacs00000000000e51c0 g    DO .bss   0000000000000008  Base        zle_entry_ptr00000000000e57bc g    DO .bss   0000000000000004  Base        zlemetall00000000000e51c8 g    DO .bss   0000000000000004  Base        zle_load_state00000000000e4ee0 g    DO .bss   0000000000000004  Base        zleactive00000000000e5080 g    DO .bss   0000000000000008  Base        zle_chline
The zleentry function looks interesting, digging through the zsh source code mirror on github we get a couple of hits. From the results, it seems that this function serves multiple purposes all controlled by this enum value. When given ZLE_CMD_READ or 1 it reads the enter command and returns a value, which means that this combination works exactly like the readline function from bash. So let’s take a stab at implementing this for zsh, we can reuse most parts from the bash script:
BEGIN{    printf("Tracing zsh commands... Hit Ctrl-C to end.\n");    printf("%-9s %-6s %s\n", "TIME", "PID", "COMMAND");}
uretprobe:/usr/bin/zsh:zleentry{    time("%H:%M:%S  ");    printf("%-6d %s\n", pid, str(retval));}
This is mostly just a copy and paste from the bashreadline script replacing the library_name name with /usr/bin/zsh (use which zsh to find the path to your zsh installation) and the function_name with zleentry.
$ sudo bpftrace ./zshreadline
Attaching 2 probes...Tracing zsh commands... Hit Ctrl-C to end.TIME      PID    COMMAND00:06:28  1712000:06:28  1712000:06:28  1712000:06:28  1712000:06:35  17120  ps aux
00:06:38  1712000:06:38  1712000:06:38  1712000:06:38  1712000:06:38  1712000:06:42  17120  cat /proc/$$/status | grep -i cap
We can see a lot of empty lines are getting logged. If you play around at the zsh prompt for a bit you might notice that quite a few actions are triggering those empty lines. But only when you type a command and press enter is when it shows up on the monitor. We noticed before that the zleentry function has many usages, so those extra lines are probably due to those other instances that are not returning any value. Let’s quickly try to verify this by writing a small uprobe one-liner:
$ sudo bpftrace -e 'uprobe:/usr/bin/zsh:zleentry { printf("arg0: %d\n", arg0); }'
Attaching 1 probe...arg0: 2arg0: 2arg0: 2arg0: 2arg0: 2arg0: 2arg0: 1arg0: 2
This prints the first argument passed to the zleentry function, when you give this a try you will notice it starts printing lot’s of 2’s well before you execute your command. The second enum value is ZLE_CMD_ADD_TO_LINE, this is not the function call we are interested in. We are only interested in ZLE_CMD_READ or 1, which is when a command is executed. bpftrace allows us to write a filter but when using uretprobe we don’t have access to the arguments passed to the function. So the best I came up with is to filter and exclude any values when the zleentry function returns an empty string (let me know in the comments if there is a better way to work around this):
$ sudo bpftrace ./zshreadline
Attaching 2 probes...Tracing zsh commands... Hit Ctrl-C to end.TIME      PID    COMMAND00:15:56  17120  ps aux00:15:58  17120  dir00:16:00  17120  echo hello00:16:15  20992  exit00:16:17  16028  ps aux
This works like a charm, we now have the same monitoring program for zsh like we do for bash. Our zshsnoop program is working!
Conclusion
I hope this gives you a good idea of the powers that are lurking deep inside the Linux kernel. And this is just the tip of the iceberg, there’s a lot more you can do with eBPF. Even the bpftrace comes with a lot more tools I haven’t covered here that you can learn from or play around with. The bashreadline or zshsnoop script we created only traces the return value of a specific function using uretprobes, it shows that a command wa entered. It doesn’t show if the command succeeded and what the output was. But you can go a lot further than that. In a coming post, we’ll have a look at ttysnoop and I’ll walk you through how in a couple of lines of python we can monitoring all input and output from a specific terminal.